The striking PEB and LDR - Part One
Introduction to PEB and Ldr
- Part One: Introduction to PEB and Ldr
Part Two: Working in progress
In the Pwn trilogy, we exploited the format print function to achieve remote code execution (RCE), during which we navigated through relocation and the Global Offset Table (GOT). While the Pwn trilogy is excellent, it is limited to the GNU/Linux platform, whereas most desktop users prefer Microsoft Windows. Unlike GNU/Linux, Microsoft Windows ships system libraries with the operating system and offers a comprehensive runtime environment.

Today, let’s focus on the Process Environment Block (PEB) and the Loader Record (LDR), which provide essential information about the base addresses of relocated program images and libraries. On Windows, the PEB address can be found at the thirteenth entry of the Thread Information Block (TIB). The fs register tracks the TIB in a 32-bit Windows environment. Meanwhile, in a 64-bit environment, the gs register tracks the TIB. Microsoft Windows supports 32-bit and 64-bit executables on most x86_64 platforms, setting the appropriate environment based on the machine field in the executable file’s header.
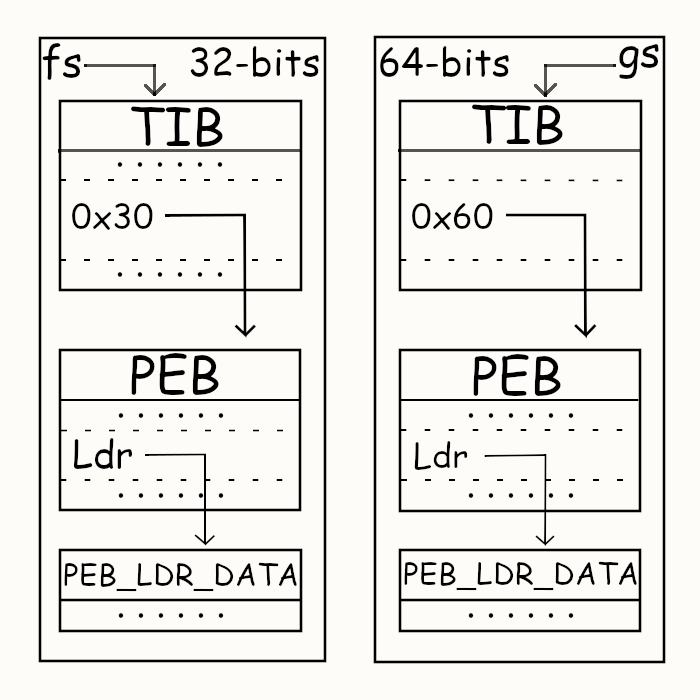
Given the differences in word sizes for 32-bit and 64-bit environments, the PEB is accessible at fs:[0x30] for 32-bit systems and gs:[0x60] for 64-bit systems. Once we can access the PEB, we can traverse the LDR entries to gather metadata about the loaded executables and libraries. This includes their relocated base addresses, module base names, full pathnames, and sizes. While this information is crucial for exploit development, we will not create an exploit here; instead, we will write a small program that prints the collected information.
MS Learn, I tell ya
Before twitchy fingers on flashing keys and writing spaghetti code like a prank, can we read the docs? Oh, right, there are docs. Microsoft provides an official website for documentation under the name Microsoft Learn. From MS Learn, we could find the official definition of the TEB structure.
typedef struct _TEB {
  PVOID Reserved1[12];
  PPEB  ProcessEnvironmentBlock;
  PVOID Reserved2[399];
  BYTE  Reserved3[1952];
  PVOID TlsSlots[64];
  BYTE  Reserved4[8];
  PVOID Reserved5[26];
  PVOID ReservedForOle;
  PVOID Reserved6[4];
  PVOID TlsExpansionSlots;
} TEB, *PTEB;
Clearly, there are twelve reserved pointers ahead of the pointer to the PEB. Therefore, we could also access the PEB with fs:[0x30] for 32-bit systems and gs:[0x60] for 64-bit systems. You may complain about the excessive appearance of the reserved fields based on the definition of the TEB structure. Therefore, let’s move on to the definition of the PEB structure.
typedef struct _PEB {
  BYTE                          Reserved1[2];
  BYTE                          BeingDebugged;
  BYTE                          Reserved2[1];
  PVOID                         Reserved3[2];
  PPEB_LDR_DATA                 Ldr;
  PRTL_USER_PROCESS_PARAMETERS  ProcessParameters;
  PVOID                         Reserved4[3];
  PVOID                         AtlThunkSListPtr;
  PVOID                         Reserved5;
  ULONG                         Reserved6;
  PVOID                         Reserved7;
  ULONG                         Reserved8;
  ULONG                         AtlThunkSListPtr32;
  PVOID                         Reserved9[45];
  BYTE                          Reserved10[96];
  PPS_POST_PROCESS_INIT_ROUTINE PostProcessInitRoutine;
  BYTE                          Reserved11[128];
  PVOID                         Reserved12[1];
  ULONG                         SessionId;
} PEB, *PPEB;
The PEB structure consists of many interesting fields, revealing whether the process is being debugged, its parameters, and the most critical loader records(LDR). The loader records form a doubly linked list with a sentinel node. We could access the doubly linked list by following the Ldr field to a PEB_LDR_DATA structure, which holds only one unreserved field, InMemoryOrderModuleList, which consists of two pointers—Blink and Flink—which in turn point to different loader record nodes in the doubly linked list.
typedef struct _PEB_LDR_DATA {
  BYTE       Reserved1[8];
  PVOID      Reserved2[3];
  LIST_ENTRY InMemoryOrderModuleList;
} PEB_LDR_DATA, *PPEB_LDR_DATA;

typedef struct _LIST_ENTRY {
   struct _LIST_ENTRY *Flink;
   struct _LIST_ENTRY *Blink;
} LIST_ENTRY, *PLIST_ENTRY, *RESTRICTED_POINTER PRLIST_ENTRY;
Though the official documentation has few words, practically, we know that the Blink usually points to the loader record with the highest address in the virtual memory, precluding the sentinel node. Similarly, the Flink points to the loader record with the lowest address in the virtual memory. We will go through this later in a debugging session. Moreover, though the definition of the LIST_ENTRY is self-recursive, the document does suggest that both pointers in the InMemoryOrderModuleList are pointers corresponding to an LDR_DATA_TABLE_ENTRY structure; we will also dive into it later.
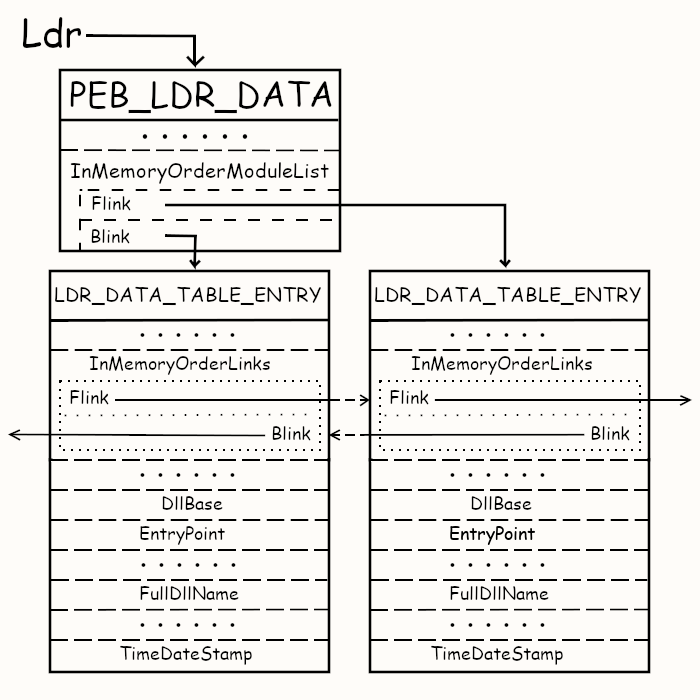
Here, we have a visual representation of the logical connection between the loader records(LDR) and the PEB. The PEB_LDR_DATA structure is an entry point for the LDR doubly linked list. The PEB structure tracks the address of the PEB_LDR_DATA structure under its Ldr field. The PEB_LDR_DATA structure tracks two specific nodes in the LDR doubly linked list: the node with the lowest virtual memory address and the node with the highest virtual memory address. Within each LDR node, there’s a specific field, InMemoryOrderLinks, which works like the InMemoryOrderModuleList but tracks the previous and the subsequent nodes in the doubly linked list. The definition of LDR_DATA_TABLE_ENTRY provides more insights into the loader records(LDR).
typedef struct _LDR_DATA_TABLE_ENTRY {
    PVOID Reserved1[2];
    LIST_ENTRY InMemoryOrderLinks;
    PVOID Reserved2[2];
    PVOID DllBase;
    PVOID EntryPoint;
    PVOID Reserved3;
    UNICODE_STRING FullDllName;
    BYTE Reserved4[8];
    PVOID Reserved5[3];
    union {
        ULONG CheckSum;
        PVOID Reserved6;
    };
    ULONG TimeDateStamp;
} LDR_DATA_TABLE_ENTRY, *PLDR_DATA_TABLE_ENTRY;
Though there are a few unfriendly reserved fields in the definition of LDR_DATA_TABLE_ENTRY, we still get helpful information about the loaded module. We have InMemoryOrderLinks helping us navigate through the doubly linked list, DllBase revealing the base address after relocation, EntryPoint if the module is executable rather than a library, FullDllName showing the full path and filename of the loaded module, a checksum, and a timestamp. Let’s ignore the checksum and timestamps for now. Could we write a small program to print out the information on loaded modules for now? I feel confident about this challenge.
Baby step, print the PEB address
We want to print out the information on the loaded modules; we start with an assembly function to get the PEB address. There are fancy ways to retrieve the PEB address without assembly, but I hate the absence of assembly when it comes to lower system stuff. We will compile the program targeting a 64-bit Windows environment, though most x86_64 platforms support 32-bit and 64-bit environments. Given that the MSVC compiler has depleted the support of in-line assembly, we start with an assembly file to get the PEB address from fs:[0x60].
.code
getPEBAddr      proc
                mov     rax, gs:[60h]
                ret
getPEBAddr      endp
                end
This small but elegant code snippet defines a procedure(another fancy name for a function) in the assembly that retrieves the PEB address from the RAX register and returns it. This function is callable in C, and the code is here.
#include <stdio.h>
#include <stdint.h>

extern uint64_t getPEBAddr();

int main() {
	const uint64_t PEB_ADDRESS = getPEBAddr();
	printf("Process Environment Block @ 0x%014llx\n",PEB_ADDRESS);
	return 0;
}
The assembly function responsible for retrieving the PEB (Process Environment Block) address is defined as an external function in a C file named getPEBAddr, which has a return type of uint64_t. In a 64-bit environment, addresses are always eight bytes long, making uint64_t a suitable type for this purpose. After retrieving the PEB address, the program prints it with leading zeros using a formatted output. The assembly function is stored in a file called c_peb_utils.asm, while the C file is named c_peb.c. Finally, let’s assemble, compile, link, and execute the program.
PS C:\Users\EvalUser\Desktop\PEB> ml64 .\c_peb_utils.asm /c /Fo:c_peb_utils.obj
Microsoft (R) Macro Assembler (x64) Version 14.43.34809.0
Copyright (C) Microsoft Corporation. All rights reserved.
PS C:\Users\EvalUser\Desktop\PEB> cl .\c_peb.c /c /Zi /DEBUG:FULL /Fd:c_peb.pdb /Fo:c_peb.obj
Microsoft (R) C/C++ Optimizing Compiler Version 19.43.34809 for x64
Copyright (C) Microsoft Corporation. All rights reserved.
c_peb.c
PS C:\Users\EvalUser\Desktop\PEB> link .\c_peb.obj .\c_peb_utils.obj /DEBUG /DEBUGTYPE:CV /PDB:c_peb.pdb /SUBSYSTEM:CONSOLE /ENTRY:main /OUT:c_peb.exe ucrt.lib kernel32.Lib
Microsoft (R) Incremental Linker Version 14.43.34809.0
Copyright (C) Microsoft Corporation. All rights reserved.
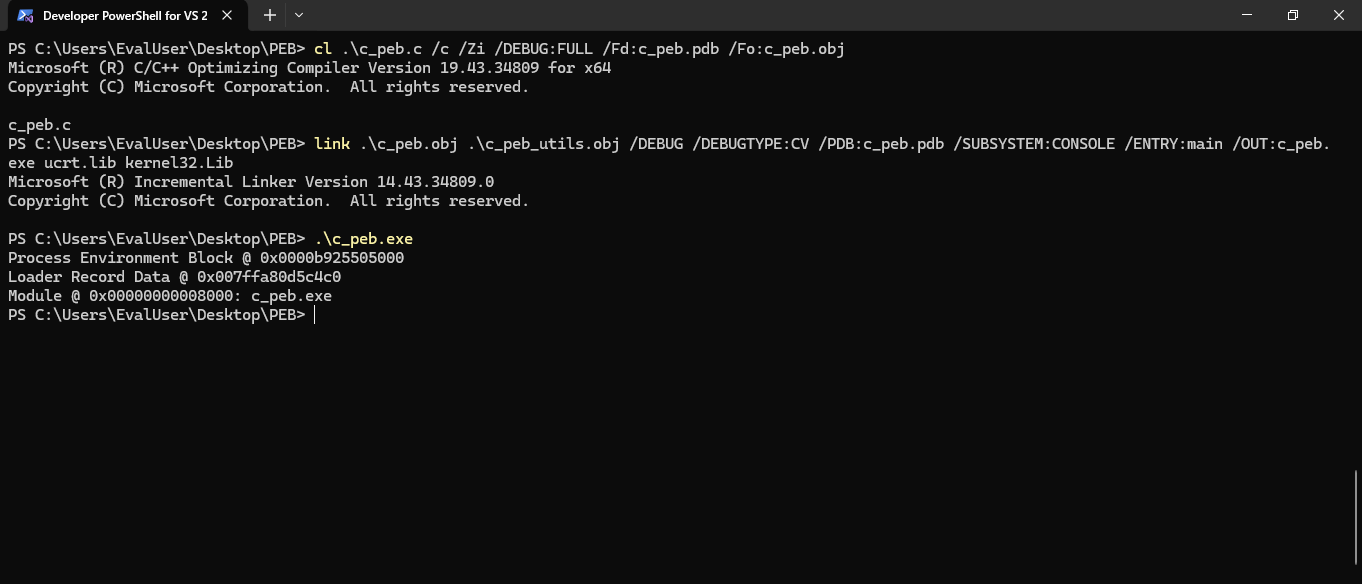
PS C:\Users\EvalUser\Desktop\PEB> .\c_peb.exe
Process Environment Block @ 0x000047546ac000
We first assemble the assembly file with the ml64 command, the MSVC assembler targeting the 64-bit environment. This produces a common object file format (COFF) file, c_peb_utils.obj, consumable by the linker. The MSVC compiler cl also creates a COFF file, c_peb.obj, and a program database file, c_peb.pdb, which holds the debug symbols. Finally, the MSVC linker link takes the COFF files and the program database file with some system and C runtime libraries and builds the final executable c_peb.exe. By providing the program database file c_peb.pdb to the linker, we enable source code level debugging for the executable.
The final executable, c_peb.exe, prints a hexadecimal address, claiming it’s the address of the PEB. Can we verify the correctness of the so-called PEB address? Indeed, we could attach a debugger to the process and inspect the PEB address within the debugger. Here we go; let’s do this with the most authentic Microsoft debugger that ships with the Windows operating system—WinDbg.
WinDbg, welcome to the internals
Previously, we had a Windows internal version of Helloworld that retrieves the PEB address with an assembly function and prints it out. We want to verify whether the printed PEB address is a waste or a valuable treasure. Therefore, welcome to the age of WinDbg.
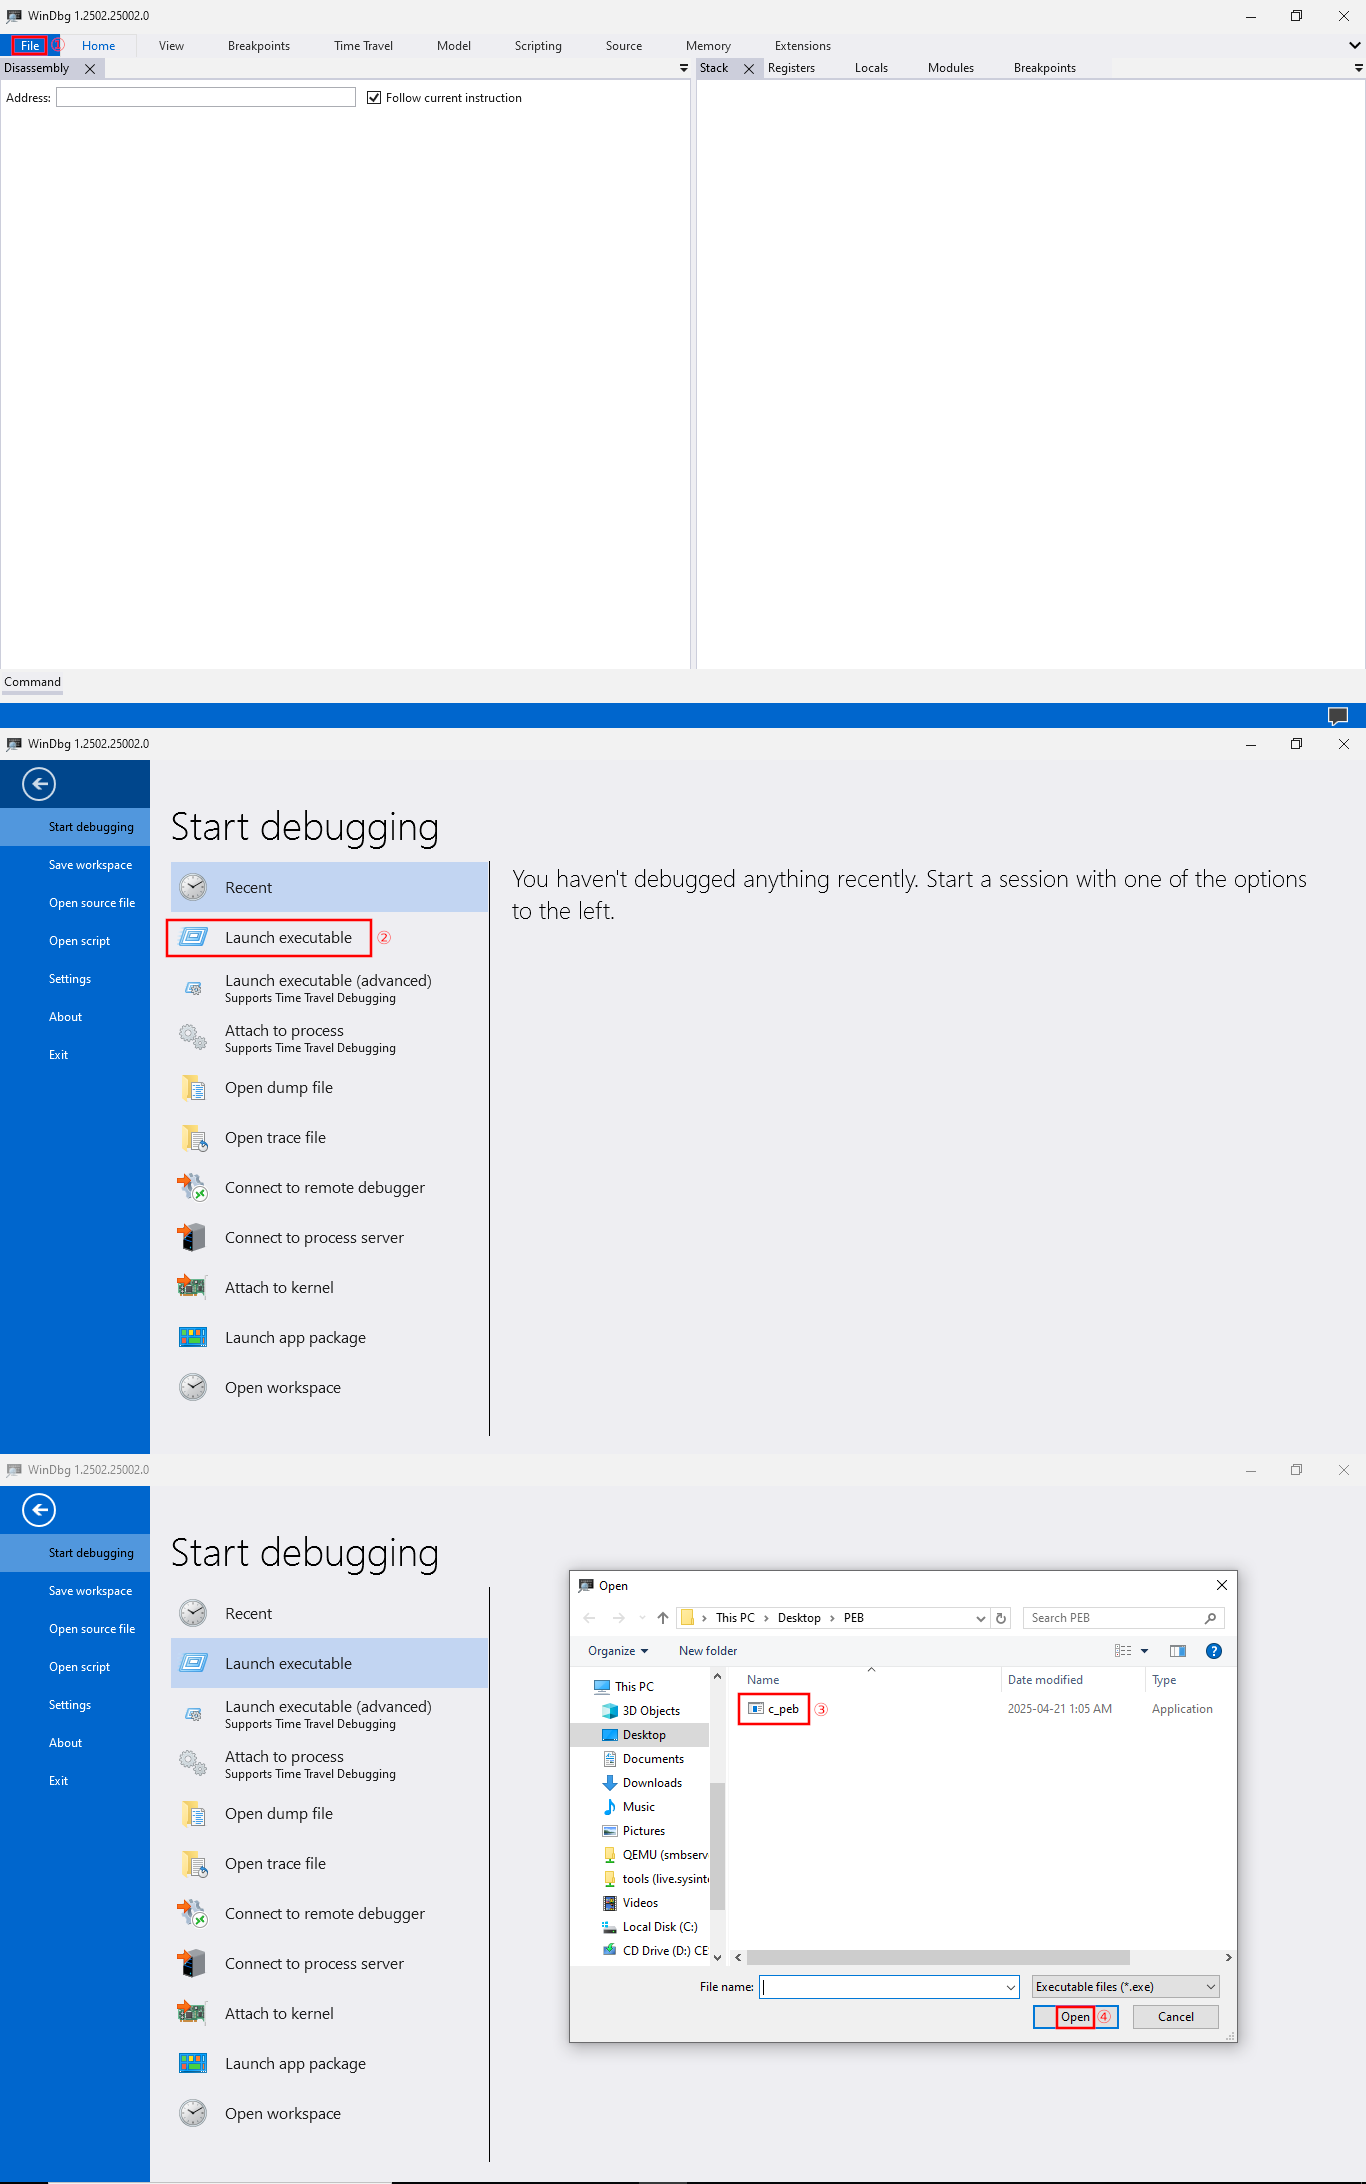
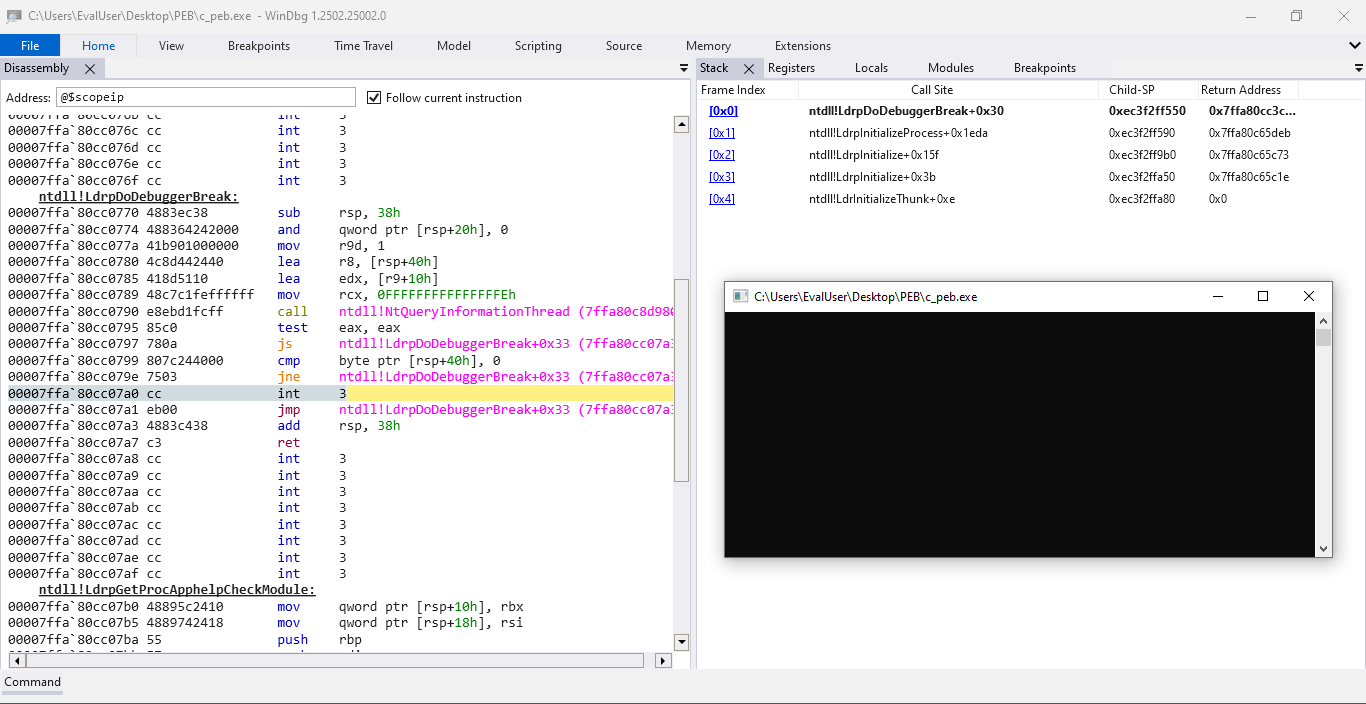
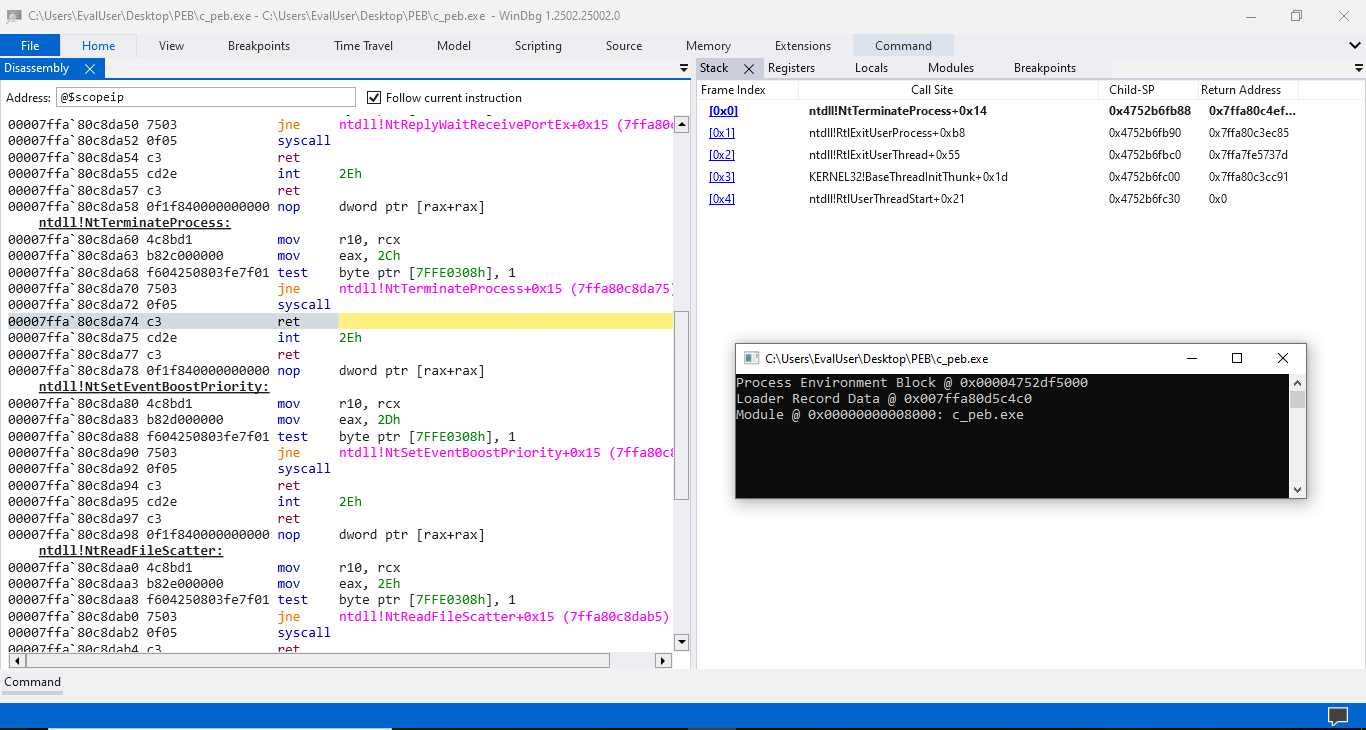
The WinDbg provides a straightforward user interface, allowing us to painlessly launch the executable for debugging. Given that our c_peb.exe is a console program, the WinDbg launches a terminal-like window for the executable. The debugger also pauses the execution at a system breakpoint just before it reaches the program entry point, which explains why the program prints nothing yet.
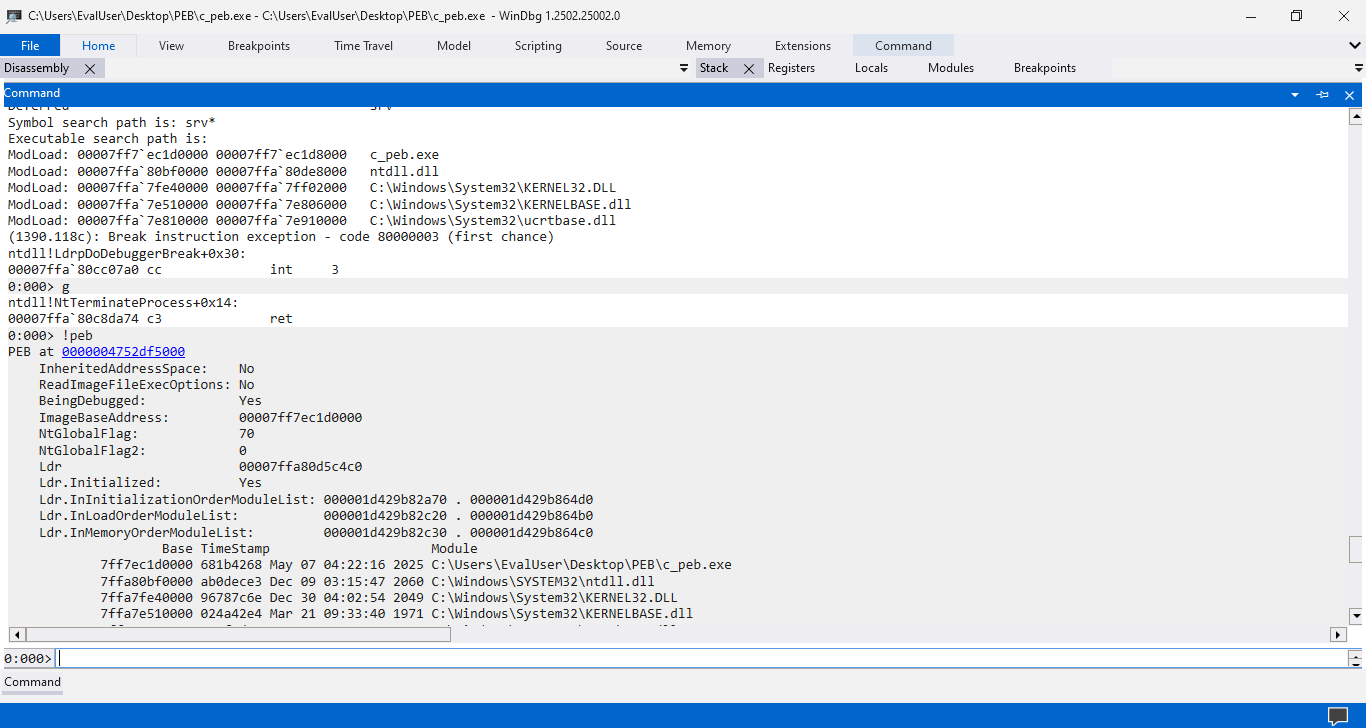
Let’s drag the WinDbg window into a vertical second monitor to view the full long output in the command view. In the command view, we can see a few messages about the environment from the debugger and an automatically executed gu command.
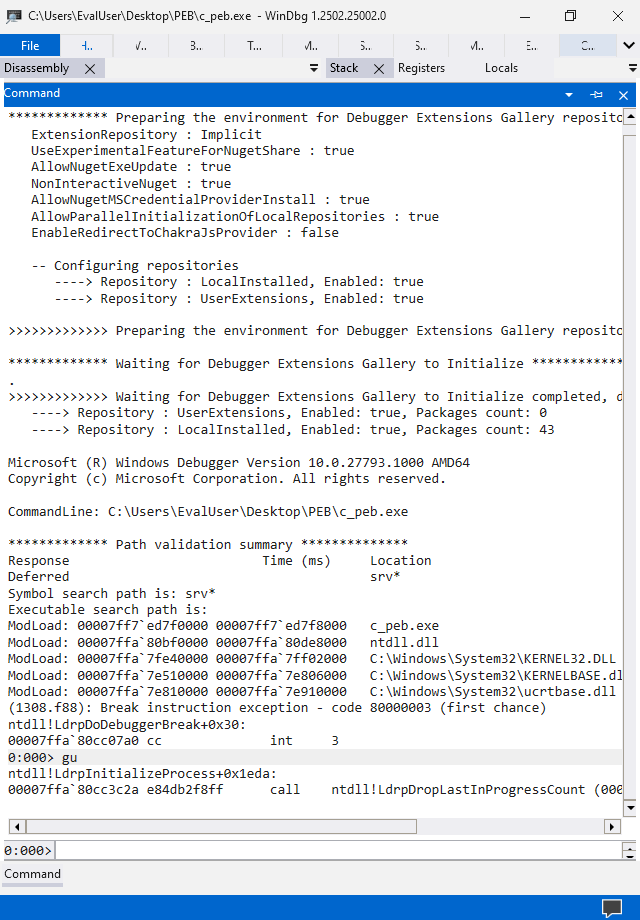
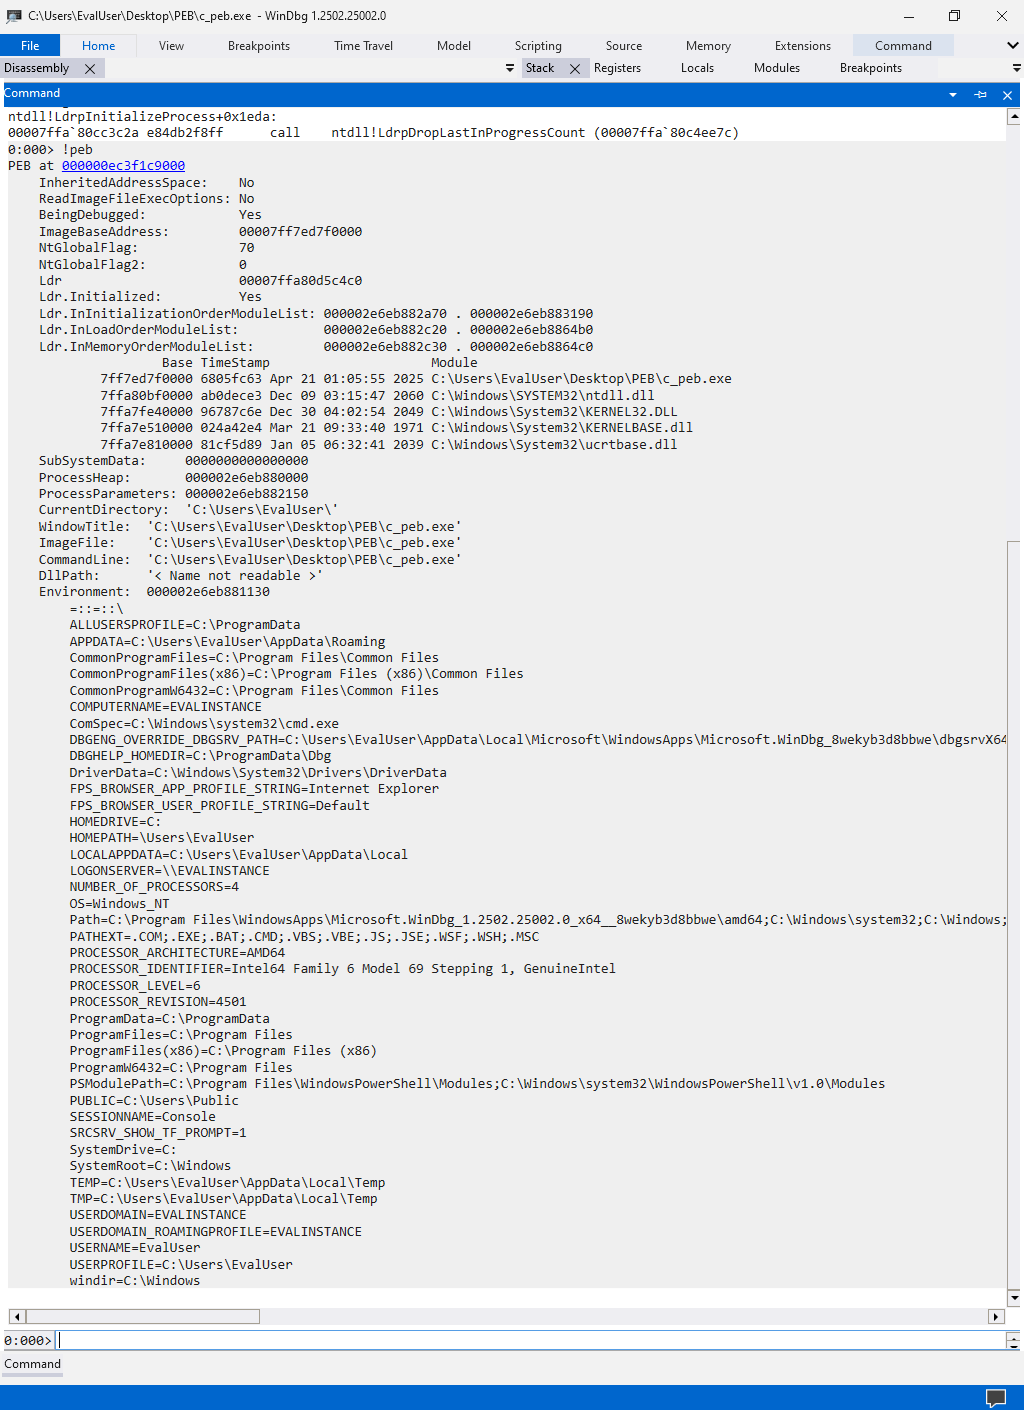
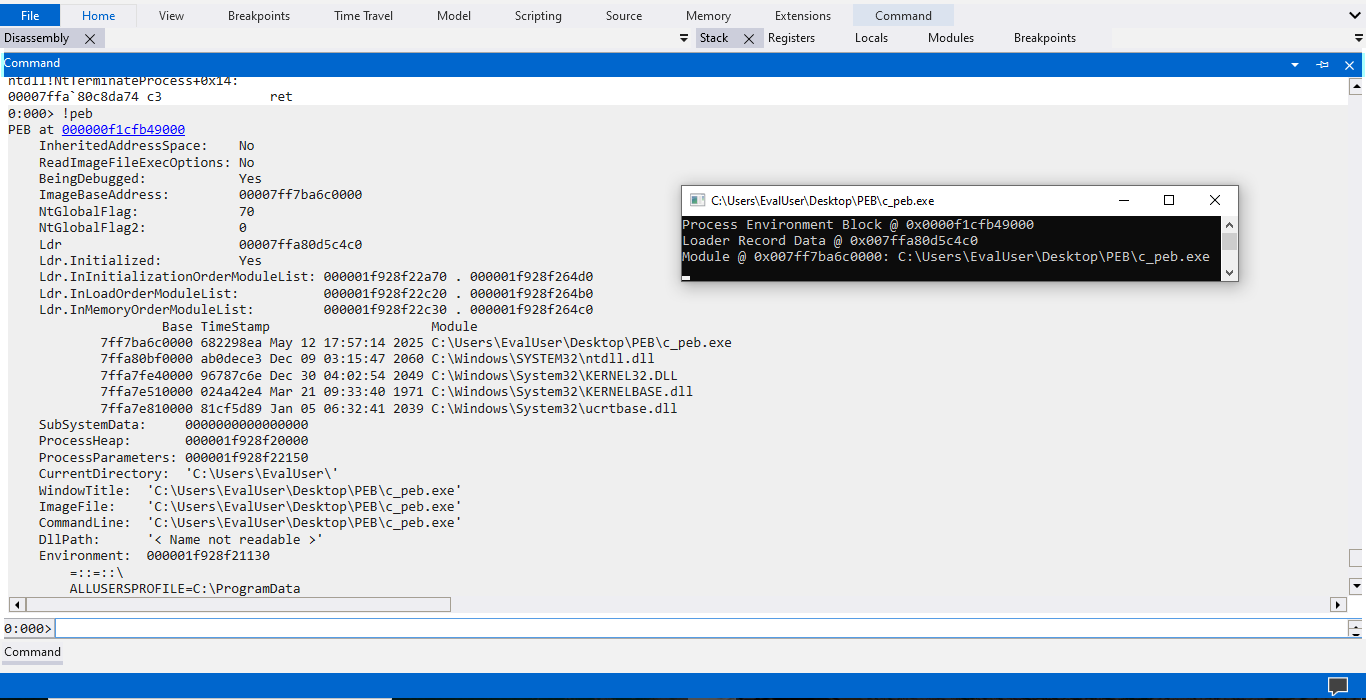
In the command view, we could use the !peb general extension command to analyze the Process Environment Block(PEB) and print a report. From the report, we could read the PEB address 0x0000ec3f1c0000, the loaded modules with the base address and full path name, command line arguments and the environmental variables. Our small program would finally list the loaded modules and print their information. I’m glad to see that there is an out-of-the-box reference for testing.
Some may complain that the PEB address provided by WinDbg differs from the previous program output 0x000047546ac000. This is expected, given that relocation happens between different process creations. Therefore, the PEB relocates to a different address when we rerun the program under the debugger. If we hit the g command, which resumes the program’s execution, letting it hit the process exit system breakpoint, we could see that the program printed PEB address is identical to what the debugger suggested.
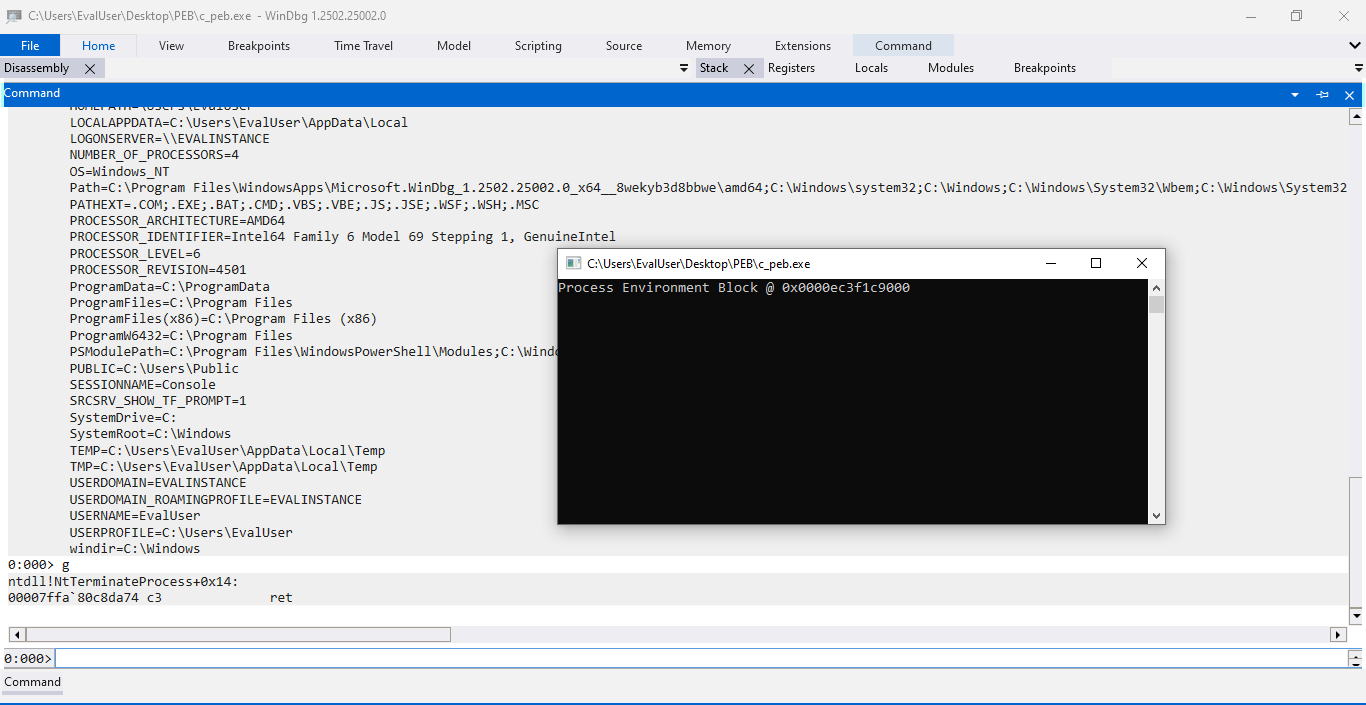
Ta-da! The program prints the exact PEB address we previously saw on the debugger. We are so glad that our Windows internal version of Helloworld greets the correct word, not some jittery Isekai! It’s time to extend our reach and print information about a loaded module.
Toddler step, print one module
It’s the toddler step here. We print the PEB address in the baby step and verify it with WinDbg. Let’s continue our exploration and print the information of one loaded module. We would follow the Ldr pointer from the PEB structure to the PEB_LDR_DATA structure, where we could find the InMemoryOrderModuleList field that tracks two pointers, each referring to a loaded module in the doubly-linked list. We won’t traverse the doubly-linked list for now, but print the relocated base address and the full pathname of an arbitrarily loaded module directly referred to by pointers in InMemoryOrderModuleList.
typedef struct _PEB {
  BYTE                          Reserved1[2];
  BYTE                          BeingDebugged;
  BYTE                          Reserved2[1];
  PVOID                         Reserved3[2];
  PPEB_LDR_DATA                 Ldr;
  ......
} PEB, *PPEB;
The Ldr pointer is the seventh field in the PEB structure, with five reserved fields and one BeingDebugged byte ahead. Three reserved fields are single-byte fields, and two are void pointers. Therefore, we have four single-byte fields (including the BeingDebugged byte) and two void pointers ahead of the Ldr pointer. In a 32-bit environment, the offset of the Ldr pointer would be 12 bytes, given that pointers are 4 bytes long. However, in a 64-bit environment, the pointers are 8 bytes long. Therefore, the compiler would pad the leading four single-byte fields with another 4 bytes to match the alignment requirement.
In a structure, padding happens when a group of adjacent fields with smaller sizes cannot align to the size of the most significant primitive type in the structure. For the structure of PEB, the most significant primitive type is the pointers with a size of 8 bytes. Under this ground, the compiler places a 4-byte padding after the four single-byte files at the beginning of the structure. Therefore, the overall offset of the Ldr pointer is 24 bytes or 0x18 in hexadecimal. The Ldr pointer points to a PEB_LDR_DATA structure. Let’s bring it to the stage.
typedef struct _PEB_LDR_DATA {
  BYTE       Reserved1[8];
  PVOID      Reserved2[3];
  LIST_ENTRY InMemoryOrderModuleList;
} PEB_LDR_DATA, *PPEB_LDR_DATA;
The PEB_LDR_DATA structure has more reserved fields. There are eight single-byte reserved fields and three reserved pointers, followed by the InMemoryOrderModuleList field. Therefore, the InMemoryOrderModuleList field is 24 bytes away from the beginning of the PEB_LDR_DATA structure. The offset in hexadecimal is 0x18 as well.
typedef struct _LIST_ENTRY {
   struct _LIST_ENTRY *Flink;
   struct _LIST_ENTRY *Blink;
} LIST_ENTRY, *PLIST_ENTRY, *RESTRICTED_POINTER PRLIST_ENTRY;
The InMemoryOrderModuleList is a LIST_ENTRY structure nested inside the PEB_LDR_DATA structure. It has two fields: Flink and Blink, each pointing to a loaded module. The Flink field shares the same virtual memory address with the InMemoryOrderModuleList field, given that offset of the Flink field to the beginning of the LIST_ENTRY structure is 0.
The Blink field is one pointer from the beginning of the LIST_ENTRY structure. Therefore, the offset of the Blink field in the LIST_ENTRY structure associated with the InMemoryOrderModuleList field to the beginning of the PEB_LDR_DATA structure is 32 bytes or 0x20 in hexadecimal. Following the Flink pointer or the Blink pointer, we could finally reach the LDR_DATA_TABLE_ENTRY structure with the information we wanted.
From the definition of the LDR_DATA_TABLE_ENTRY structure, we can see that there are four reserved pointers and an in-place LIST_ENTITY structure ahead of the DllBase field, which holds the base address of this specific module after relocation. Given that the LIST_ENTITY structure consists of two pointers, the six are generally ahead of the DllBase field. Therefore, the offset from the beginning of the LDR_DATA_TABLE_ENTRY structure to the DllBase field is 48 bytes, or 0x30 in hexadecimal.
typedef struct _LDR_DATA_TABLE_ENTRY {
    PVOID Reserved1[2];
    LIST_ENTRY InMemoryOrderLinks;
    PVOID Reserved2[2];
    PVOID DllBase;
    PVOID EntryPoint;
    PVOID Reserved3;
    UNICODE_STRING FullDllName;
    ......
} LDR_DATA_TABLE_ENTRY, *PLDR_DATA_TABLE_ENTRY;
With similar logic, the FullDllName field is two pointers from the DllBase field, which implies its offset from the beginning of the LDR_DATA_TABLE_ENTRY structure is 72 bytes or 0x48 in hexadecimal, where the DllBase field itself is a pointer. In light of the offsets, we could have two helper functions to get the virtual memory address of the FullDllName field and the DllBase field, with a known address of the LDR_DATA_TABLE_ENTRY structure. The getFullName helper function depends on another helper function, getWCharAtAddr, to decode the full name reference into a wide-character pointer. We will cover it later.
#define LDR_DLLBASE_OFFSET 0x30ULL
void *getDllBase(const uint64_t addr) {
	const uint64_t dllBase_addr = addr + LDR_DLLBASE_OFFSET;
	const uint64_t dllBase = getULLAtAddr(dllBase_addr);
	return (void *) dllBase;
}
#undef LDR_DLLBASE_OFFSET

#define LDR_FULLNAME_OFFSET 0x48ULL
wchar_t *getFullName(const uint64_t addr) {
	const uint64_t fullname_addr = addr + LDR_FULLNAME_OFFSET;
	return getWCharAtAddr(fullname_addr);
}
#undef LDR_FULLNAME_OFFSET
The DllBase is a void pointer that is printable in a way similar to the PEB address. However, like InMemoryOrderModuleList, FullDllName is a nested structure within the LDR_DATA_TABLE_ENTRY structure, namely the UNICODE_STRING structure. We could find its definition in MS Learn.
typedef struct _UNICODE_STRING {
  USHORT Length;
  USHORT MaximumLength;
  PWSTR  Buffer;
} UNICODE_STRING, *PUNICODE_STRING;
The UNICODE_STRING structure encapsulates a string buffer that tracks the content’s length and buffer capacity. The Length field tracks the legitimate content’s length, while the MaximumLength field tracks the buffer’s capacity. Given that the buffer is designed for wide characters, the content might not be null-terminated.
Thanks to the Length field and the MaximumLength field, both unsigned short integers, the buffer pointer might be 4 bytes from the beginning of the UNICODE_STRING structure. However, recall the alignment requirement mentioned before; the longest primitive type in the structure is a wide char pointer, 8 bytes long. Therefore, the compiler would place a 4-byte padding between the end of the unsigned short integers and the buffer pointer. Under this ground, we could write a tiny helper function to extract the buffer pointer from the UNICODE_STRING structure.
#define USTR_BUFFER_OFFSET 0x08ULL
wchar_t *getUSTRBuf(const void * ptr) {
	const uint64_t addr = (uint64_t) ptr;
	const uint64_t ustrBuf = addr + USTR_BUFFER_OFFSET;
	const uint64_t bufaddr = getULLAtAddr(ustrBuf);
	wchar_t *bufptr = (void *) bufaddr;
	return bufptr;
}
#undef USTR_BUFFER_OFFSET
The getUSTRBuf helper retrieves the pointer to the wide char buffer from the FullDllName field, but we still need a way to print it. Luckily, there are also formatted wide-character output conversion functions from the C standard library. We could employ the wprintf function whenever wide characters are involved. Moreover, the getUSTRBuf helper takes a void pointer as the parameter. Therefore, let’s introduce a wrapper function getWCharAtAddr for type conversion, which is used in the getFullName helper.
wchar_t *getWCharAtAddr(const uint64_t addr) {
	const void *ptr = (void *) addr;
	return getUSTRBuf(ptr);
}
We have the relocated base address of the loaded module and a pointer to the wide-character buffer, which holds the full pathname of the loaded module. We pick the module directly pointed by the Flink pointer from the InMemoryOrderModuleList field of the PEB_LDR_DATA structure. We could extend our Helloworld program to print out the pathname and the relocated base address of the specific loaded module.
#define PEB_LDR_OFFSET 0x18ULL
#define PEB_LDR_MODLST_OFFSET 0x20ULL

int main() {
	const uint64_t PEB_ADDRESS = getPEBAddr();
	printf("Process Environment Block @ 0x%014llx\n",PEB_ADDRESS);
	// Calculate the address of the Ldr field from the PEB address
	const uint64_t PEB_LDR_ADDR = PEB_ADDRESS + PEB_LDR_OFFSET;
	// Retrieve the address of PEB_LDR_DATA from the Ldr field
	const uint64_t LDR_ADDRESS = getULLAtAddr(PEB_LDR_ADDR);
	printf("Loader Record Data @ 0x%014llx\n",LDR_ADDRESS);
	// Calculate the address of the the InMemoryOrderModuleList
	// InMemoryOrderModuleList is a nested struct within PEB_LDR_DATA
	// The Flink field shares the same offset of the InMemoryOrderModuleList
	const uint64_t LDR_MODLIST = LDR_ADDRESS + PEB_LDR_MODLST_OFFSET;
	// Get the address of the LDR_DATA_TABLE_ENTRY pointed by Flink
	// LDR_DATA_TABLE_ENTRY holds information of a loaded module
	// LDR_DATA_TABLE_ENTRY entities form a doubly-linked list covering all loaded modules
	const uint64_t LDR_MODNODE = getULLAtAddr(LDR_MODLIST);
	// Retrieve relocated base address and full pathname of the loaded module
	const void *dllbase = getDllBase(LDR_MODNODE);
	const wchar_t *fullname = getFullName(LDR_MODNODE);
	// Print out information with wide characters
	wprintf(L"Module @ 0x%014llx: %ls\n",(uint64_t) dllbase,fullname);

	return 0;
}
We compile, assemble, and execute the program with the new content. We have positive feedback that the program does print something like an address and the module name.
The output is weird, given that the relocated base address is too close to the beginning of the virtual memory address space. Some malware loads malicious code into that region, but that’s not the case here. We implemented nothing like a stager or loader in our small program, so it’s more like a size than an address. Also, the module name should have the full path rather than a basename. There must be something wrong. Time for the debugger.
Display Type, no more reserved
We previously created a small program to print information about a specific module, including its relocated base address and full pathname. Unfortunately, both values were incorrect. To clear the myth, here is the WinDbg.
Here, we stop at the exit breakpoint, which is triggered when the program under debugging is about to exit. This exit breakpoint allows us to capture the complete console output from the program while preserving the runtime context. We can examine the Process Environment Block (PEB) and the loaded modules without worrying about relocations. We inspect the PEB using the !peb general extension command.
The command output shows that the PEB is at 0x4752df5000 and the c_peb.exe module is relocated to 0x7ff7ec1d0000, not 0x8000. To figure out what’s wrong with our program, we could click on the PEB’s address from the command output. The address is marked in blue, suggesting it is a link worth clicking.
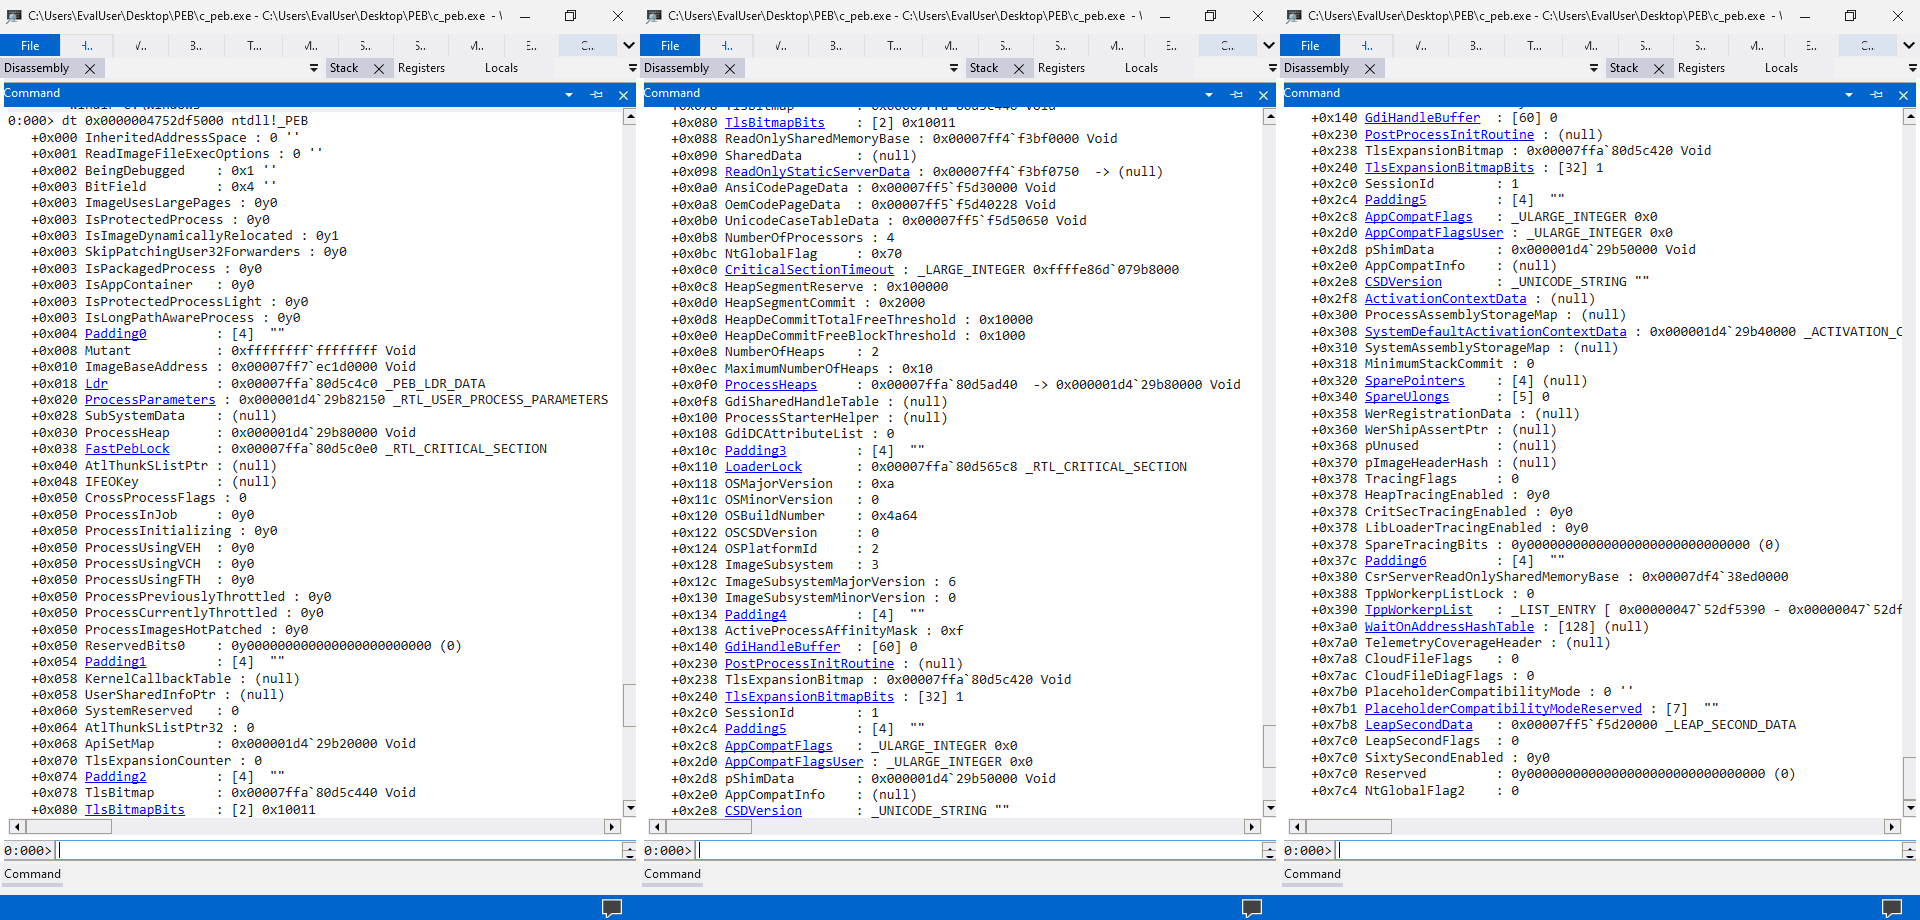
Whoa, a simple click leads to such a long yield. According to MS Learn, the link associated with the PEB’s address triggers a dt command, which is short for “display type”. The command takes a type name and an address and parses data at the designated address into a structure inferred from the provided type name. The link launches a dt command, parsing the PEB memory trunk into a _PEB structure (a synonym for the PEB structure) from the ntdll module.
Unlike the official document, the dt command reveals more information about the PEB structure without any reserved field. This is brilliant, as we can finally lift the veil and get close to the internal data structures of the Windows runtime. In future articles, we will cover the reserved fields of the PEB structures. For now, let’s focus on the loaded modules.
With the same logic as in our small program, we follow the Ldr field in the PEB structure and reach the PEB_LDR_DATA structure in the debugger. We could click the in-place links from the command outputs. We then click the InMemoryOrderModuleList link and the Flink link, hoping to reach the LDR_DATA_TABLE_ENTRY structure pointed by the Flink field.
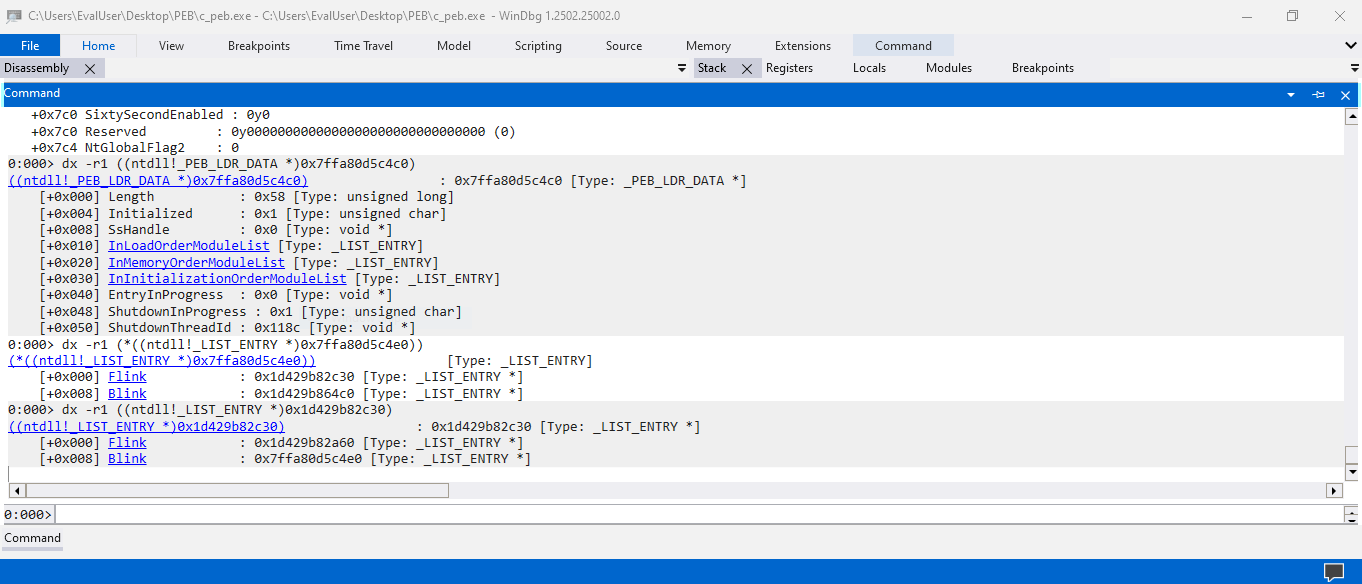
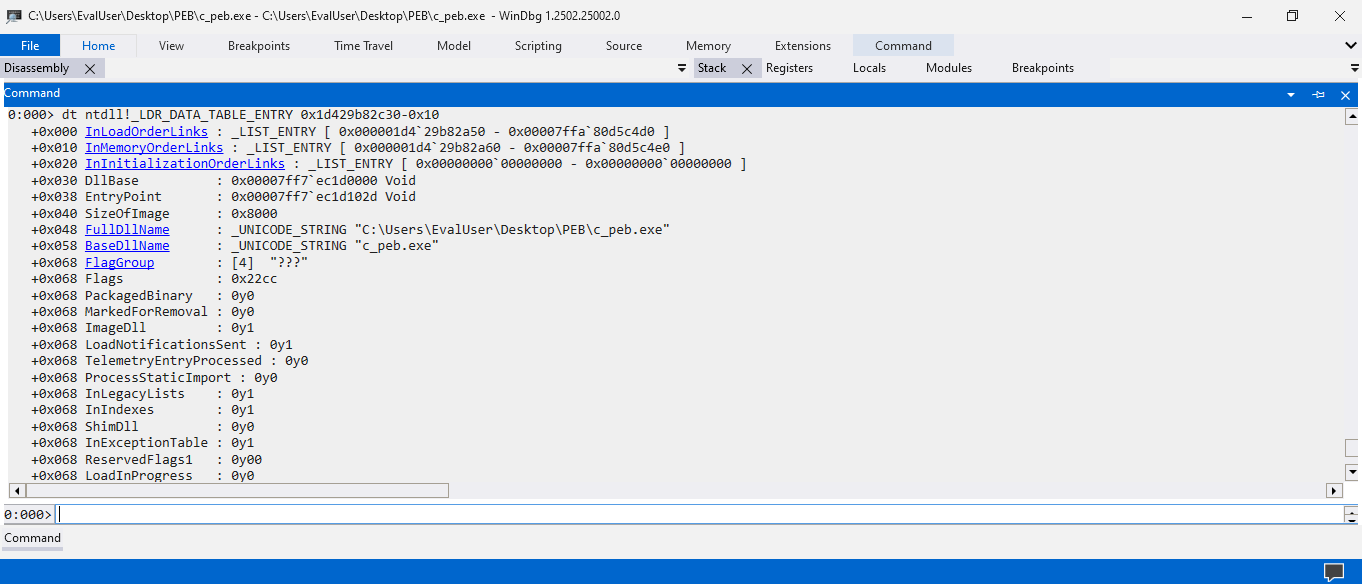
Surprisingly, the link associated with the Flink field within the InMemoryOrderModuleList doesn’t lead to an LDR_DATA_TABLE_ENTRY structure but to another LIST_ENTRY structure. Under these circumstances, we could copy the value from the Flink field and paste it into a manually typed dt command with the type name specified to LDR_DATA_TABLE_ENTRY. The command forces the debugger to decode the provided address into the LDR_DATA_TABLE_ENTRY structure. The output of the command means a lot.

The dt command on the LDR_DATA_TABLE_ENTRY structure reveals what’s behind the reserved fields. It seems that the fields before and after the InMemoryOrderLinks field are the InLoadOrderLinks field and the InInitializationOrderLinks field, which are all LIST_ENTRY structures. Perhaps, they all refer to the doubly-linked lists consisting of the same module nodes but with different orders. Moreover, there’s a SizeOfImage field between the EntryPoint field and the FullDllName field. A BaseDllName field also follows the FullDllName field.
We now have more insights into the actual data fields in the LDR_DATA_TABLE_ENTRY structure. It’s reassuring to read disclosed information without reserved fields. However, the values associated with these fields are quite unusual: the DllBase is 0x8000, the EntryPoint is 0x50004e, the SizeOfImage is excessively large—bigger than the actual PE file—the FullDllName does not include the path, and the BaseDllName appears to be nonsensical. Fortunately, the DllBase and the FullDllName are consistent with our program’s output. But what happens here?
Recall that we previously stated the value 0x8000 is more like a size rather than an address. Moreover, there is a SizeOfImage field, which is 0x10 away from the DllBase field. Furthermore, the FullDllName field is also 0x10 away from the BaseDllName field, where the value referred to by the FullDllName field contains only the basename of the executable file, rather than the full pathname. So what if we take the 0x10 offset into account? We could manually apply it to the address part of the dt command.
Everything looks great with the 0x10 offset! The DllBase and EntryPoint appear to be authentic now. The value 0x8000 corresponds to the SizeOfImage field. The FullDllName contains the full pathname of the current executable, while the basename is stored in the BaseDllName field. Toodaloo! We could update our small program with the magic offset and see how it comes.
#define LDR_BASE_ADJUSTMENT 0x10ULL

int main() {
	......
	// Get the address of the LDR_DATA_TABLE_ENTRY pointed by Flink
	// Apply the magic offset LDR_BASE_ADJUSTMENT to the retrieved address
	// LDR_DATA_TABLE_ENTRY holds information of a loaded module
	// LDR_DATA_TABLE_ENTRY entities form a doubly-linked list covering all loaded modules
	const uint64_t LDR_MODNODE = getULLAtAddr(LDR_MODLIST) - LDR_BASE_ADJUSTMENT;
	......
}
The 0x10 offset works, but we still wonder why it works. The InMemoryOrderLinks field is 0x10 bytes from the beginning of the LDR_DATA_TABLE_ENTRY structure. So the pointers in the InMemoryOrderModuleList field from the PEB_LDR_DATA structure are actually pointing to the nested LIST_ENTRY structures within the LDR_DATA_TABLE_ENTRY structure. This explains why, when we first click the Flink field, the debugger decodes the target address as a LIST_ENTRY structure.
Apparently, the definition of the LIST_ENTRY structure is accurate, in that the member pointers only point to other LIST_ENTRY structures. Our assumption that the Flink pointer points to the LDR_DATA_TABLE_ENTRY instance is not precise, given that it does point to a nested structure within LDR_DATA_TABLE_ENTRY rather than the beginning of it. We could get the beginning address of the LDR_DATA_TABLE_ENTRY with a simple arithmetic, but it’s not out-of-the-box. Anyway, the small program works fine, so it’s time for a celebration.
Conclusion
This is the first part of our journey exploring the magical land of PEB and Ldr. In this section, we reviewed essential system structures such as TIB, PEB, and the Ldr doubly-linked list. We also wrote a small program to display basic information about a specific loaded module. In the second part of our journey, we will traverse the Ldr doubly-linked list to print information about all loaded modules, as well as some reserved information related to them.